Stock Market Analysis Platform
This project provides a modular system for retrieving stock data, computing technical indicators, displaying interactive charts, and generating buy/sell signals based on a sample strategy. It leverages Streamlit, yfinance, and tulipy to offer a user-friendly interface for stock analysis and strategy prototyping.
Project Structure
.
├── main.py
├── README.md
├── strategy.py
└── submodules/
    ├── data_retrieval.py
    ├── display.py
    └── indicators.py
main.py: The primary entry point, runs a Streamlit app for user interaction.strategy.py: Contains the base strategy and a sample strategy for generating buy/sell signals.submodules/: A folder containing modular files:data_retrieval.py: Fetches data from Yahoo Finance (or CSV).display.py: Builds interactive Plotly charts.indicators.py: Provides functions to compute various technical indicators using tulipy.archive/: Contains older or alternative scripts (e.g.,twitter_scraper.py) not actively used in the current workflow.
Features
- Data Retrieval:
- Pull real-time or historical data from Yahoo Finance via
yfinance. - Handle different intervals (e.g.,
1m,5m,1d,1mo) with logic to avoid API issues. -
Optionally load data from user-provided CSV files.
-
Technical Indicators:
- Wide range of tulipy indicators available (e.g., MACD, EMA, RSI, ADX).
-
Dynamically configure indicator parameters (periods, etc.) through the user interface.
-
Chart Visualization:
- Generate interactive Plotly charts with dynamic overlays for indicators.
- Optional subplots for separate indicator panels.
-
Mark buy/sell signals on the price chart.
-
Strategy Integration:
- Built-in sample strategy that demonstrates how to combine multiple indicators (MACD, RSI, ADX, EMA) to generate entry/exit signals.
-
Easy extension or customization of strategies in
strategy.py. -
Streamlit Dashboard:
- User-friendly web UI for selecting ticker symbols, date ranges, intervals, and indicator parameters.
- Run locally or on a server for real-time usage.
Installation
- Clone the Repository:
bash git clone https://github.com/yourusername/stock-market-analysis.git cd stock-market-analysis - Create a Virtual Environment (Recommended):
bash python -m venv venv source venv/bin/activate # on macOS/Linux # or venv\Scripts\activate # on Windows - Install Dependencies:
bash
    pip install streamlit yfinance tulipy plotly pandas numpy ib_async streamlit-autorefresh
Make sure your Python version is compatible (3.8+ recommended due to dependencies liketulipy).
Usage
- Run the Streamlit App:
bash streamlit run main.py -
Open Browser: Streamlit will print a local URL (e.g.,
http://localhost:8501). Open this in your web browser. -
Select Parameters:
- Ticker: e.g.,
INTC - Start Date and End Date: Defines the time range.
- Interval: e.g.,
1m,5m,1d, etc. - Indicators: Choose from any valid tulipy indicators. Provide numeric parameters (e.g., period lengths).
- Ticker: e.g.,
-
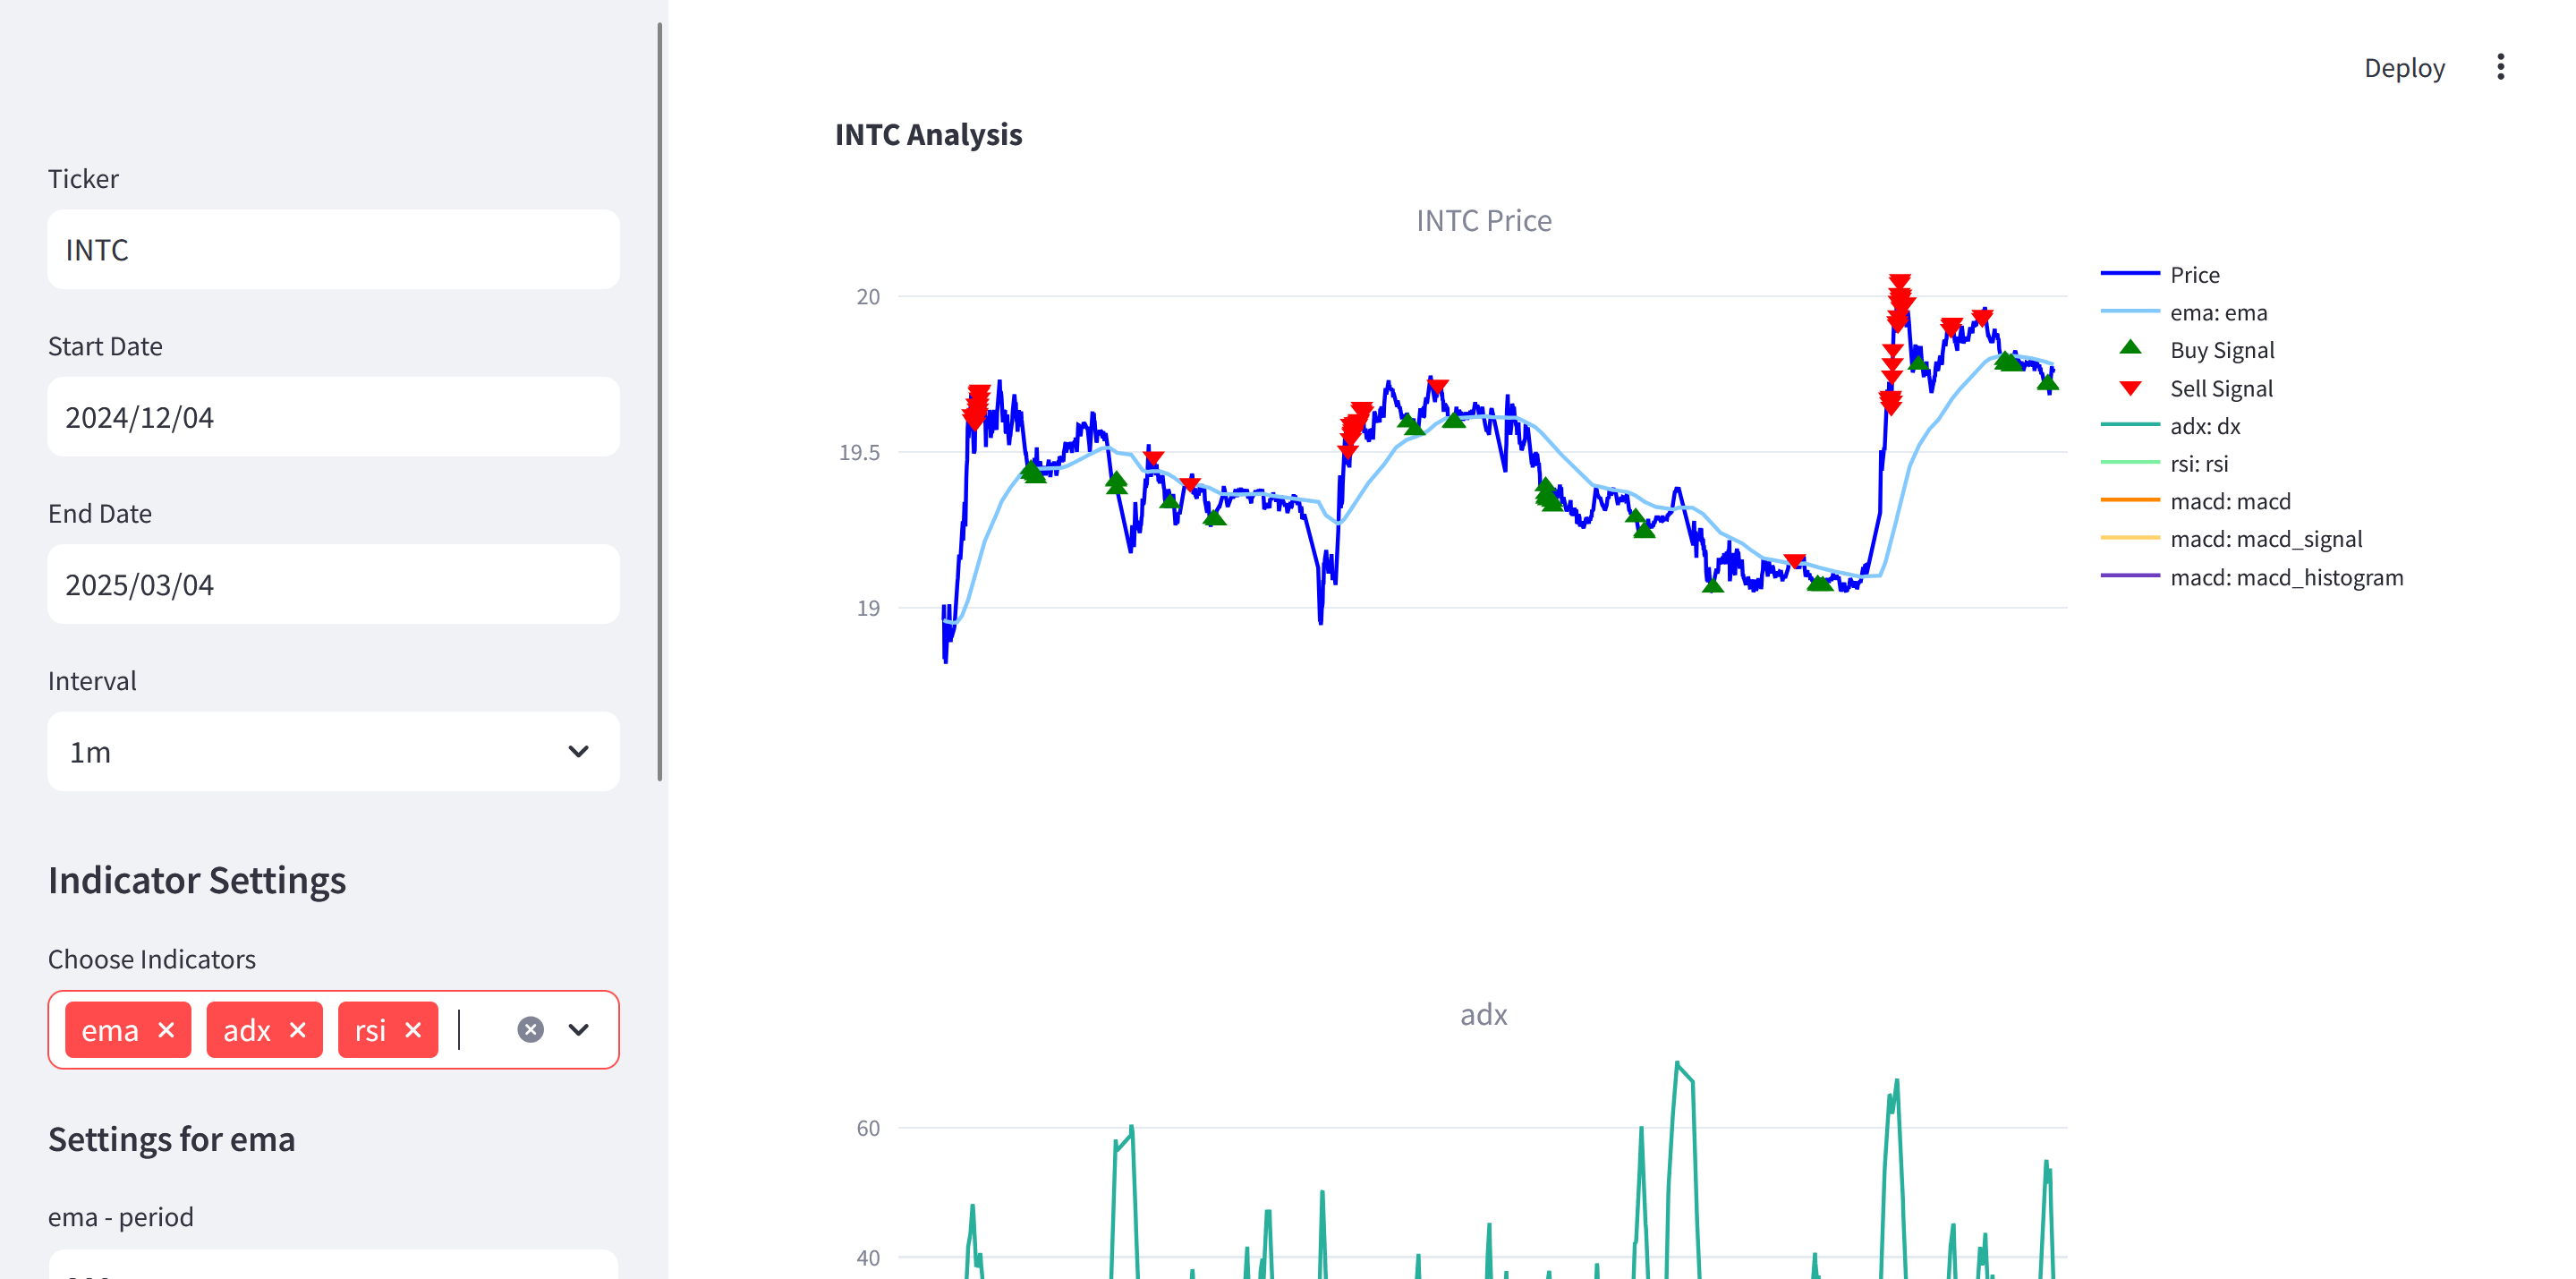
View Results:
- Main chart (price history) with overlays (e.g., EMA).
- Additional subplots (e.g., MACD, RSI).
- Buy/Sell signals from the sample strategy, shown as markers on the main chart.
Components
5.1. Main Application (main.py)
- A Streamlit-driven UI that handles user inputs (Ticker, Date Range, Interval).
- Retrieves data through
get_yfinance_data(...)indata_retrieval.py. - Collects selected indicators and their parameters; calls
compute_indicator(...)inindicators.py. - Initializes a
SampleStrategy(fromstrategy.py) and obtains buy/sell signals. - Displays everything via the
build_stock_chart(...)function indisplay.py.
Key blocks:
- User Input:
st.sidebar.text_input,st.sidebar.date_input,st.sidebar.selectbox. - Indicator Settings:
st.sidebar.multiselectand dynamic numeric inputs. - Strategy Computation:
strategy = SampleStrategy(...); callsgenerate_signals(). - Chart Rendering:
st.plotly_chart(...).
5.2. Submodules
data_retrieval.py
get_yfinance_data(...): Fetches OHLCV data from Yahoo Finance using yfinance.- Incorporates logic to limit date ranges for different intervals, circumventing API restrictions.
- Returns NumPy arrays for
date_index,open,high,low,close,volume.
load_csv_data(...): (Optional) load user-provided CSV if required. It expects columns: Date, Open, High, Low, Close, Volume.
display.py
build_stock_chart(...): Creates a multi-panel Plotly chart:- Primary panel for price (with optional overlays, e.g., EMA).
- Additional panels for indicators like RSI or MACD.
- Plots buy/sell signals as special markers if provided.
indicators.py
indicator_info(...): Retrieves metadata (name, type, input fields, parameter options) from tulipy for a given indicator.get_valid_indicators(): Returns all valid indicators recognized by tulipy for either overlay or standard indicator usage.compute_indicator(...):- Dynamically constructs arguments (open, high, low, close, volume, plus user parameters).
- Calls the tulipy function. Some indicators produce multiple outputs (e.g., MACD => MACD, signal, histogram).
- Returns a tuple
(list_of_output_names, list_of_numpy_arrays).
5.3. Strategy Layer (strategy.py)
-
BaseStrategy(abstract class):- Manages references to
price_data, already-computed indicators, and user parameters. ensure_indicators_loaded(): If a strategy requires specific indicators, it checks if they’re already computed. If not, computes them with default or user-provided params.generate_signals(): An abstract method that child classes override to produce buy/sell signals.-
SampleStrategy: -
Inherits from
BaseStrategy. required_indicators(): Specifies indicator defaults (ema,macd,rsi,adx) plus their typical parameters.generate_signals(): Demonstrates a rudimentary multi-indicator strategy.- Example signal logic:
- Buy if MACD > MACD signal, MACD signal < 0, ADX >= 20, and RSI <= 40.
- Sell if MACD < MACD signal, MACD signal > 0, ADX >= 20, and RSI >= 60.
- Example signal logic:
- Manages references to
Technical Overview
6.1. Data Retrieval
yfinanceis used to download OHLCV data.- Different intervals impose maximum date ranges (e.g.,
1mdata can only be fetched for ~30 days). The code indata_retrieval.pyautomatically segments or adjusts queries to avoid errors.
6.2. Indicators
- tulipy library underpins the technical analysis.
- Each indicator has:
- Inputs (required data arrays: close, high, low, etc.).
- Options (numeric parameters like
period). - Outputs (one or more arrays, e.g., MACD => [macd, signal, histogram]).
- The user picks which indicators to compute via the Streamlit UI. Additional parameters can be adjusted there.
6.3. Display & Visualization
- Plotly is leveraged in
display.pyto present:- Candlestick or line charts (line by default).
- Indicator overlays on the main chart (e.g., EMA).
- Separate subplot panels for indicators such as RSI or MACD.
- Buy/Sell markers from the strategy.
6.4. Strategy Logic
- Strategies can be as simple or as complex as needed:
- Overriding
required_indicators()ensures the strategy has all it needs. generate_signals()uses indicator arrays for logical conditions.- Return arrays of timestamps and prices for buy/sell events.
- Overriding